Implied Probability for Touchdown Bets: Spotting Mispriced Odds
 Available in US
Implied probability is simply the scoring likelihood that a bookmaker’s odds suggest. Every set of decimal odds can be converted to a percentage, and comparing that percentage to a player’s actual scoring rate tells you whether the price is fair, generous, or a trap. Most punters skip this step entirely, which is precisely why it provides an edge for those who don’t.
Implied Probability Formula and Practical Examples
The calculation is as simple as division gets. Take 1, divide it by the decimal odds, and multiply by 100 to get the implied probability as a percentage. That’s it. No complex modelling, no software required — just one divided by the number on your screen.
Let’s work through three examples that cover the range of prices you’ll see in TD prop markets.
A heavy favourite priced at 1.65 decimal odds. Implied probability: 1 / 1.65 = 0.606, or 60.6%. The bookmaker is telling you this player has roughly a six-in-ten chance of scoring. Players priced in this range are typically bellcow running backs on high-scoring teams. The question to ask is whether the player has actually scored in 60% or more of his games this season. If he’s scoring in 50% of games, the price is too short and you should pass.
A mid-range candidate priced at 3.00. Implied probability: 1 / 3.00 = 0.333, or 33.3%. A one-in-three chance of scoring. These are often WR1s or secondary running backs. At this price, the player needs to score in roughly one of every three games to be a break-even proposition. If his actual scoring rate sits at 40% or above, you’ve found value.
A longshot priced at 7.00. Implied probability: 1 / 7.00 = 0.143, or 14.3%. Roughly one in seven. These are tight ends, backup backs, or WR2s. The threshold here is lower, but the margin for error is also wider. A player who scores in 20% of his games at 7.00 odds is a strong value play — the gap between 14.3% implied and 20% actual is substantial over a season’s worth of bets.
Removing the Bookmaker Margin to Find True Odds
Here’s something that tripped me up for years: the implied probabilities you calculate from listed odds don’t add up to 100%. They add up to more, typically between 105% and 115% for TD prop markets. That excess is the bookmaker’s margin — their built-in profit edge, known as the vig or overround.
The UK’s remote gambling sector generated GGY of £7.8 billion for the year ending March 2025, and a meaningful slice of that revenue comes from the margins embedded in prop markets. Understanding how to account for this margin is essential for accurate value assessment.
To remove the margin and estimate true probability, you need to normalise the implied probabilities. The simplest method is to calculate the implied probability for each outcome in the market, sum them, and then divide each individual probability by that sum. If a two-way TD prop has implied probabilities of 55% (to score) and 55% (not to score), the sum is 110%. The true probability of scoring is 55/110 = 50%. The bookmaker’s 5% margin was split equally between both sides.
This de-vigged probability is what you compare against your own estimate of the player’s scoring likelihood. If your research suggests a player scores in 50% of his games and the de-vigged probability is 45%, you’ve got a value bet. If the de-vigged probability is 52%, the edge is on the bookmaker’s side and you should walk away.
Comparing Implied Probability to Historical TD Rates
The real power of implied probability emerges when you stack it against historical data. 73.9% of all NFL touchdowns since 2010 have come from inside the red zone, and this baseline helps you calibrate whether a player’s implied scoring probability makes sense given his red-zone involvement.
I maintain a simple spreadsheet for each NFL week where I log three numbers per player: the best available decimal odds, the implied probability, and the player’s season-to-date TD rate. Any player whose TD rate exceeds the implied probability by five percentage points or more goes on my shortlist. That five-point threshold isn’t arbitrary — it accounts for natural variance, small sample sizes, and the margin that de-vigging doesn’t perfectly remove.
Historical TD rates need context, though. A player who scored in 50% of his first six games might be riding unsustainable luck rather than demonstrating true scoring ability. I weight recent performance (last four games) more heavily than season-long data, and I cross-reference with red-zone usage metrics to determine whether the scoring rate is supported by opportunity. A player scoring frequently despite modest red-zone involvement is likely due for regression, while a player with heavy red-zone usage who hasn’t scored recently is likely due for positive regression.
This comparative approach works best for anytime TD props, which is the most heavily traded player prop by handle. The more liquid the market, the more efficient the pricing tends to be — but TD prop markets are still less efficient than main markets like spreads and totals, which means value opportunities persist throughout the season for punters willing to do the arithmetic. For a deeper look at how touchdown odds work across formats, that comparison informs every calculation discussed here.
When the Numbers Point Away from the Bet
The hardest discipline in implied probability analysis is walking away from a bet you want to make. I’ve lost count of the times I’ve identified a player I love on tape, checked the implied probability, found no value, and placed the bet anyway out of conviction. Those conviction bets have a losing record in my ledger. The numbers are cold, impersonal, and frustratingly right more often than my instincts.
If the implied probability after removing the margin is higher than your estimated scoring probability, the bet is a pass. Full stop. No exceptions for “but this week is different” or “the matchup is too good.” The whole point of calculating implied probability is to let the maths override the narrative. Over hundreds of bets, that discipline is the difference between a profitable season and an expensive hobby.
What implied probability threshold signals value in a TD bet?
A useful threshold is a five-percentage-point gap between the de-vigged implied probability and the player’s actual scoring rate. If a player’s odds imply a 30% scoring chance but he has scored in 35% or more of his games — supported by strong red-zone usage — the bet offers value. Smaller gaps may not be sufficient to overcome natural variance and the residual margin that de-vigging doesn’t fully remove.
How do I remove the bookmaker margin from touchdown odds?
Calculate the implied probability for each outcome in the market by dividing 1 by the decimal odds. Sum all the implied probabilities — they will exceed 100%. Then divide each individual probability by that total sum. The result is the de-vigged or true probability for each outcome. Compare this to your estimated player scoring rate to determine whether the bet offers value.
This material was created by the Endzone Edge team.
Related posts
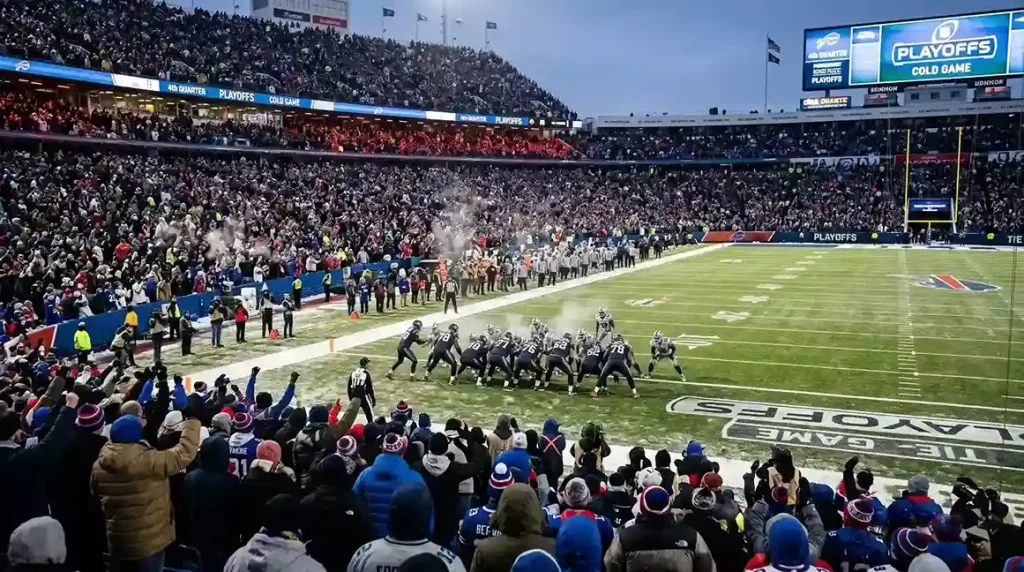
NFL Playoff Touchdown Props: How Postseason Football Changes the TD Equation

NFL TD Prop Record Keeping: How to Track Your Bets and Measure Your Edge