NFL TD Betting Strategy: Finding Value in Touchdown Props
 Available in US
The shift happened when I stopped treating TD props like a prediction game and started treating them like an investment process. Anytime touchdown scorer is the single most popular player prop by betting handle — it generates more money wagered than receiving yards, rushing yards, or any other individual player market. That volume means the market is reasonably efficient, which means consistent profit requires a systematic edge, not gut feel. The strategy I’m about to walk through isn’t complicated, but it is disciplined. Five steps, applied weekly, with the patience to trust the process when individual results don’t cooperate.
Identifying High-Volume Scoring Candidates
You can’t score a touchdown if you’re never near the end zone. That sounds painfully obvious, yet I watch punters every Sunday back players based on name recognition while ignoring the one data point that matters most: how often does this player actually touch the ball in scoring territory?
Red-zone usage is the foundation of touchdown probability. 73.9% of all NFL touchdowns since 2010 have been scored from inside the 20-yard line, which means the players most likely to score are the ones most frequently involved when their offence reaches that zone. The first step in my weekly process is building a candidate list based on volume metrics — not talent, not reputation, not last week’s highlights.
For running backs, I look at two numbers: carries inside the 20-yard line and carries inside the 5-yard line. A back who sees 4+ carries inside the 20 per game is a consistent TD candidate. One who also gets 2+ carries inside the 5 is a strong candidate, because nearly half of all red-zone touchdowns happen from that close range. I set minimum thresholds and filter ruthlessly — if a running back doesn’t meet the volume floor, he comes off my board regardless of how talented he is.
For wide receivers and tight ends, the equivalent metric is red-zone targets. How many times is this player targeted on passing plays inside the 20? A receiver seeing 3+ red-zone targets per game is operating in the volume range that produces consistent touchdowns. Below 2 per game, and you’re betting on big plays from outside the red zone or low-probability scoring, which introduces variance I’d rather avoid.
The minimum thresholds I use are guidelines, not rigid cutoffs. Context matters — a running back might see only 2 carries inside the 20 in a game where his team barely reached the red zone, but he got 100% of the goal-line work when they did. That’s a different situation from a back seeing 2 carries inside the 20 on a team that went there eight times and gave the work to a committee. Share of opportunity matters as much as raw volume. A player who gets 80% of his team’s goal-line carries on a team that reaches the red zone four times per game is a better bet than a player who gets 50% of goal-line carries on a team reaching it six times.
After filtering, I typically have 10-15 players across the Sunday slate who meet my volume criteria. That’s too many to bet on — the next steps narrow the list to 3-5 actual selections.
Step Two: Grade the Defensive Matchup
Two running backs with identical red-zone usage can have wildly different touchdown probabilities on any given Sunday, and the difference almost always comes down to who they’re playing against. Defensive matchup grading is where strategy separates from data collection.
I grade each matchup using defensive red-zone touchdown rate — the percentage of red-zone possessions on which a defence allows a touchdown. During the 2025 season, only four defences held opponents below 50% in the red zone: Denver, Minnesota, the LA Rams, and the LA Chargers. Those four teams created hostile scoring environments. Players facing them needed exceptional volume to overcome the defensive suppression. On the other end, defences allowing 60%+ red-zone touchdowns were giving away scores, inflating the TD probability for every opposing skill player.
My grading scale is simple. A-grade matchups are defences allowing 60%+ red-zone touchdowns — these are soft spots where even mid-volume players have scoring upside. B-grade is 55-60%, roughly league average with a slight lean toward the offence. C-grade is 50-55%, neutral territory. D-grade is 45-50%, tough matchups where only high-volume players are worth backing. F-grade is below 45% — I avoid these matchups entirely unless I find an extreme pricing anomaly.
Beyond the overall defensive grade, I look at positional splits. Does this defence give up touchdowns primarily to running backs, or are they vulnerable through the air in the red zone? A defence that stacks the box and plays man coverage might shut down the run game near the goal line but leave tight ends and slot receivers open over the middle. Matching the right offensive profile against the right defensive weakness produces a sharper edge than simply targeting “bad defences” in general.
The matchup grade acts as a multiplier on the volume data from Step One. A high-volume player facing an A-grade matchup goes to the top of my shortlist. A high-volume player facing an F-grade matchup drops off. A medium-volume player facing an A-grade matchup stays on the radar if the pricing is right. The combination of volume and matchup quality produces a more reliable rank order than either metric alone.
Step Three: Calculate Implied Probability and Spot Mispricing
This is the step that separates punters who bet on players from punters who bet on value. Finding a player likely to score is half the job. The other half is determining whether the odds on offer are actually worth taking.
Every set of odds embeds an implied probability — the bookmaker’s estimation of how likely the event is to happen, plus their margin. The formula is simple: divide 1 by the decimal odds. A player priced at 2.50 to score anytime has an implied probability of 1 / 2.50 = 0.40, or 40%. A player at 3.50 has an implied probability of roughly 28.6%. A longshot at 8.00 carries an implied probability of 12.5%.
The question you need to answer is: does my analysis suggest this player’s actual scoring probability is higher than what the odds imply? If I’ve gone through Steps One and Two and concluded that a running back has roughly a 50% chance of scoring in a given game — based on his red-zone volume, his goal-line role, and a soft defensive matchup — but the bookmaker has him priced at 2.50 (40% implied), then there’s a gap. I’m estimating 50%, the market is pricing 40%. That 10-percentage-point difference is where long-term profit comes from.
I’m not pretending the estimation is precise. Nobody can calculate a player’s exact touchdown probability to the decimal point. But you don’t need precision — you need to be directionally correct and disciplined about only betting when the gap between your estimate and the market’s implied probability is wide enough to absorb the bookmaker’s margin. I use a minimum threshold of 5 percentage points. If my estimate exceeds the implied probability by less than 5 points, I pass. If it exceeds it by 5+ points, the bet qualifies.
The bookmaker’s margin — the vig or juice — is baked into every price. On a typical anytime TD market, the total implied probability across all players in a game sums to more than 100%, sometimes considerably more. That excess represents the bookmaker’s edge. When I calculate implied probability from the posted odds, I’m looking at a number that slightly overstates the true probability because it includes the margin. Removing the margin to find “true” odds requires dividing each player’s implied probability by the sum of all implied probabilities in the market. This refinement matters most when comparing odds across bookmakers, which is exactly what Step Four addresses.
One mental trap I see constantly: punters confuse “likely to score” with “good bet.” A star running back at 1.60 odds is very likely to score — implied probability around 62%. But if your analysis puts his actual probability at 58%, he’s a bad bet despite being a likely scorer. The favourite isn’t always the value play. Sometimes the best bet in the market is a second-string tight end at 5.00 whose actual scoring probability is 25% while the market is pricing him at 20%.
Step Four: Line Shopping Across UK Bookmakers
I once found the same player priced at 2.80 on one UK bookmaker and 3.20 on another for the same game. That’s a 14% difference in potential payout on an identical bet. Over a season of 50+ TD prop selections, consistently taking the better price adds up to hundreds of pounds in additional returns — or the difference between a profitable year and a losing one.
Line shopping means checking the same anytime TD prop across multiple bookmakers before placing your bet and taking the best available price. It sounds tedious. It takes about two minutes per selection. And it is the single highest-ROI habit you can develop as a touchdown prop bettor.
Why do prices differ? UK bookmakers set their own TD prop odds based on slightly different models, different risk exposures, and different customer profiles. A bookmaker that’s received heavy public money on a star running back might shade his odds shorter (lower payout) to limit their liability, while a competitor who hasn’t seen the same volume might still be offering a longer price. The player’s actual probability of scoring hasn’t changed — but the price you can get for backing him varies based on which bookmaker you use.
The practical workflow is straightforward. After Steps One through Three produce my qualified selections, I check each one across three to four UK bookmakers before placing. I have accounts with multiple operators specifically for this purpose. The comparison takes less time than making a cup of tea, and the edge it provides compounds over every single bet I place. Even a difference of 0.10 in decimal odds — say, 2.90 versus 2.80 — translates to meaningful long-term value when multiplied across dozens or hundreds of selections per season.
I don’t always take the best price if there’s a meaningful difference in bookmaker reliability or settlement speed, but those situations are rare among major UK operators. For the most part, the highest price wins. If two bookmakers offer identical odds, I’ll lean toward the one with better cash-out flexibility or the one where I have a stronger account standing, but the primary decision driver is always the number.
Step Five: Factor in the Projected Game Script
Everything I’ve covered so far deals with pre-game preparation — data you can gather before kickoff. Game script adds a forward-looking dimension: what kind of game is this likely to be, and how does that shape who scores?
The relationship between game script and touchdown type is well-documented. Teams that are trailing pass more frequently, which creates more receiving touchdowns for wide receivers and tight ends. Teams that are leading run the ball more, which generates more rushing touchdowns for running backs. The Super Bowl itself has become increasingly pass-heavy, with five of seven touchdowns in the most recent edition coming through the air. This pass-first trend in high-stakes games reflects a broader offensive shift, but the run-pass balance in any individual game is heavily influenced by the score.
Vegas lines serve as the best available proxy for projected game script. The point total (over/under) tells you how many combined points the market expects, which correlates with overall touchdown opportunities — higher totals mean more scoring, which benefits all touchdown candidates. The point spread tells you which team is expected to lead, which predicts the run-pass balance. A team favoured by 7+ points is projected to lead for significant portions of the game, which increases rushing TD opportunities for their running backs and passing TD opportunities for the trailing team’s receivers.
I use game script as a final filter, not a primary driver. If Steps One through Four have produced a qualified running back selection, but the spread projects his team as a heavy underdog likely to trail by multiple scores, I’ll downgrade him slightly because trailing teams abandon the run game. Conversely, a wide receiver on a team projected to trail gets a slight upgrade because his team will be throwing more. For a more detailed treatment of how game flow predictions influence TD prop selections, I’ve covered the mechanics in my game script and touchdown props breakdown.
Game script analysis doesn’t override strong volume and matchup data, but it can break ties and shift marginal selections in or out of your final card. It’s the difference between a good system and a great one.
Balancing Favourites and Longshots in Your Selections
There’s a tempting narrative in TD betting that goes like this: back the heavy favourite, collect a small profit, repeat. The star running back at 1.70, the elite tight end at 2.20, the obvious picks that “should” score. The problem is that obvious picks carry compressed odds and compressed margins for error, and when they miss — which they do, regularly — the losses wipe out several wins’ worth of profit.
The 2025 season offered a brutal illustration. One of the league’s top rushers led the NFL with over 1,600 rushing yards, and his anytime TD line was consistently short. Bettors hammered him week after week. But he went scoreless in 8 of his 17 games — nearly half the season — because high volume doesn’t guarantee touchdowns. The fantasy points kept piling up, but the TD bet kept losing. He ended the season as one of the biggest loss leaders for bettors on major sportsbooks, precisely because his price never reflected the actual hit rate.
The opposite extreme — loading up exclusively on longshots at 6.00 or higher — is equally flawed. Hit rates on longshots are low by definition, and you need a strong stomach for long losing streaks while waiting for the occasional big payout. Most punters can’t psychologically handle a 15% hit rate even if the expected value is positive, and they abandon the approach before the math has time to work.
The approach that’s served me best over nine years blends both. I structure my weekly selections around two or three “base” picks — high-volume, favourable-matchup players priced in the 2.00-3.00 range who I expect to hit roughly 40-50% of the time. These provide a steady foundation. Then I add one or two “reach” picks — players with lower volume but a specific matchup angle or usage spike that creates value at longer odds, typically in the 4.00-7.00 range. The base picks grind out small profits or limit losses most weeks; the reach picks provide the upside that turns a breakeven week into a strong one.
Tom Brolley, a betting analyst at Fantasy Points, highlighted an example of how raw yardage can be misleading for touchdown purposes: one prominent receiver averaged over 275 receiving yards for every receiving touchdown he scored, well below the league average of about 152 yards per TD. High yardage, low scoring. The market priced him based on his yardage volume, but the touchdown conversion rate told a different story. That’s the kind of disconnect a blended approach is designed to exploit — the base picks are straightforward, but the reach picks target exactly these pricing gaps.
Putting It Together: A Weekly TD Betting Workflow
Strategy without routine is just theory. Here’s how the five steps translate into a weekly calendar that I follow during the NFL season.
Tuesday is data day. The previous week’s games are in the books, and I update my tracking spreadsheet with red-zone usage numbers, goal-line carry shares, and defensive red-zone rates. This takes about 30 minutes. I’m not making any selections yet — I’m refreshing the dataset that drives everything else.
Wednesday is matchup day. I pull up the upcoming week’s schedule and grade each relevant matchup using defensive red-zone data. I cross-reference my high-volume player list against those grades and produce a shortlist of 10-12 candidates who have both the usage and the matchup to justify a closer look. Another 30 minutes, sometimes less if the matchups are straightforward.
Thursday is pricing day. Early odds for Sunday’s games typically appear on major UK bookmakers by midweek. I check each candidate’s anytime TD price across my accounts, calculate the implied probability, and compare it to my estimated probability from the volume and matchup data. Players who clear my 5-percentage-point value threshold go onto the final card. Players who don’t get cut, regardless of how much I like them on paper. This step takes 20-30 minutes and is the most important discipline in the entire process — it’s where I say no to bets that feel right but aren’t priced right.
Sunday morning is confirmation. I check final injury reports (released 90 minutes before kickoff), confirm that nothing has changed since Thursday, and place my bets. I typically end up with 3-5 selections across the day’s slate. Occasionally I’ll add a reach pick if a late scratch opens up unexpected value — when a starting running back is ruled out, his backup’s red-zone role expands, and the market doesn’t always adjust the backup’s price quickly enough.
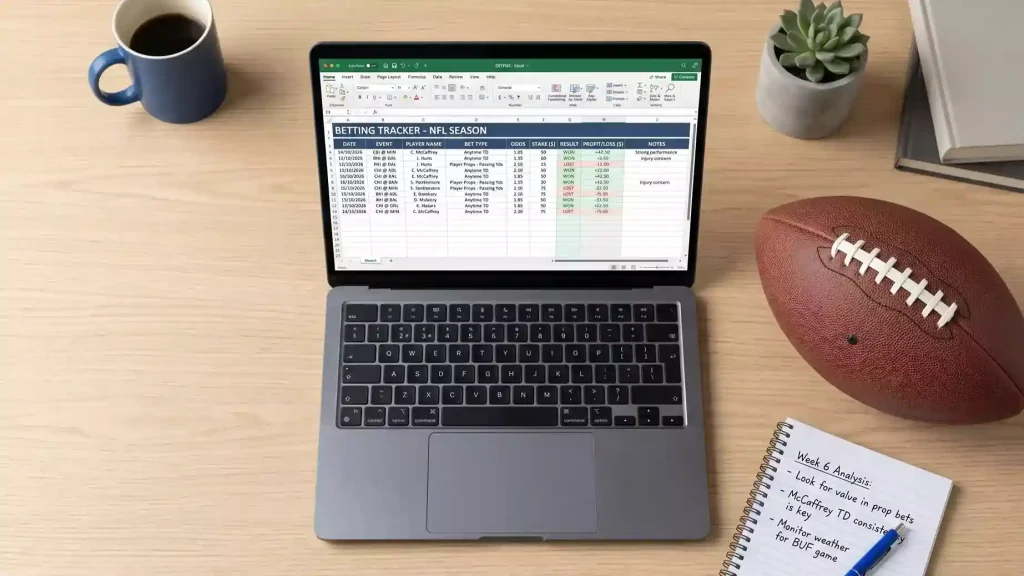
After the games, I record every bet — selection, odds taken, stake, result, and the key metrics that justified the pick. This record-keeping is non-negotiable. Without it, I can’t evaluate whether my process is working, which metrics are pulling their weight, and where I’m making systematic errors. Over a full season, the log tells a story that individual wins and losses never can.
The total weekly time commitment is roughly two to three hours. That’s not nothing, but it’s manageable alongside a full-time job, and it’s a fraction of the time most punters spend watching preview shows and reading tip sheets that don’t teach them anything transferable. The system is the edge, and the system only works if you run it consistently.
Frequently Asked Questions About TD Betting Strategy
How many touchdown bets should I place per week?
I typically place 3-5 anytime TD bets per NFL Sunday slate. This range is large enough to capture multiple opportunities without over-extending your bankroll. Quality matters far more than quantity — five well-researched selections based on volume, matchup, and pricing analysis will outperform fifteen gut-feel picks over any meaningful sample. If your process only produces two qualified bets in a given week, place two. Forcing a fifth or sixth pick to hit a target number is how discipline breaks down.
Is it better to bet favourites or longshots for anytime TD?
Neither exclusively. A blended approach works best — two or three base picks at shorter odds (2.00-3.00 range) provide consistency, while one or two reach picks at longer odds (4.00-7.00) add upside. The key is that every selection must clear your value threshold regardless of its price point. A favourite at 1.80 with no value gap is a bad bet. A longshot at 6.00 with a genuine pricing edge is a good bet. Let the data and the pricing drive the decision, not a preference for one end of the odds spectrum.
What is the most important stat for picking touchdown scorers?
Red-zone usage — specifically, carries inside the 5-yard line for running backs and targets inside the 20 for receivers. 73.9% of all NFL touchdowns are scored from the red zone, and 47.3% of red-zone touchdowns happen from within 5 yards of the goal line. Players who dominate their team’s touches in this compressed scoring zone have the highest structural probability of scoring, regardless of other factors like total yards or receptions.
How do I track whether my TD betting strategy is profitable?
Record every bet in a spreadsheet: date, player, odds taken, stake, result, and the key metrics that justified the selection. After 100+ bets, calculate your return on investment (total profit or loss divided by total stakes) and your yield (average return per unit staked). A sustainable TD prop strategy should target 3-8% long-term yield. Equally important, track closing line value — whether the odds you took were better than the final odds at kickoff. Consistently beating the closing line is the strongest indicator of genuine edge.
This material was created by the Endzone Edge team.
Related posts
NFL Playoff Touchdown Props: How Postseason Football Changes the TD Equation
NFL TD Prop Record Keeping: How to Track Your Bets and Measure Your Edge